How Science News Outlets Can Lie To You (Yes, Even If They Cite Studies!)
In this special edition, learn how to see through tricks used by news outlets and research publications. Don’t blindly believe statistics and be aware of biases in scientific research.
Each Monday, we’re going to be bringing you cutting-edge research reviews to not only make your health and productivity crazy simple, but also, constantly up-to-date.
But today, in this special edition, we want to lay out plain and simple how to see through a lot of the tricks used not just by popular news outlets, but even sometimes the research publications themselves.
That way, when we give you health-related science news, you won’t have to take our word for it, because you’ll be able to see whether the studies we cite really support the claims we make.
Of course, we’ll always give you the best, most honest information we have… But the point is that you shouldn’t have to trust us! So, buckle in for today’s special edition, and never have to blindly believe sci-hub (or Snopes!) again.
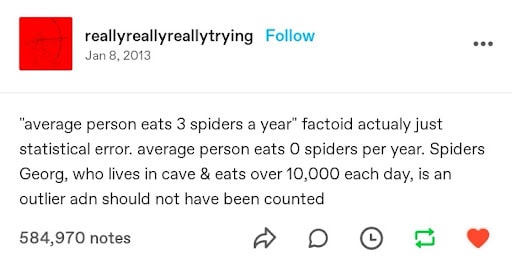
The above now-famous Tumblr post that became a meme is a popular and obvious example of how statistics can be misleading, either by error or by deliberate spin.
But what sort of mistakes and misrepresentations are we most likely to find in real research?
Spin Bias
Perhaps most common in popular media reporting of science, the Spin Bias hinges on the fact that most people perceive numbers in a very “fuzzy logic” sort of way. Do you?
Try this:
- A million seconds is 11.5 days
- A billion seconds is not weeks, but 13.2 months!
…just kidding, it’s actually nearly thirty-two years.
Did the months figure seem reasonable to you, though? If so, this is the same kind of “human brains don’t do large numbers” problem that occurs when looking at statistics.
Let’s have a look at reporting on statistically unlikely side effects for vaccines, as an example:
- “966 people in the US died after receiving this vaccine!” (So many! So risky!)
- “Fewer than 3 people per million died after receiving this vaccine!” (Hmm, I wonder if it is worth it?)
- “Half of unvaccinated people with this disease die of it” (Oh)
How to check for this: ask yourself “is what’s being described as very common really very common?”. To keep with the spiders theme, there are many (usually outright made-up) stats thrown around on social media about how near the nearest spider is at any given time. Apply this kind of thinking to medical conditions.. If something affects only 1% of the population (So few! What a tiny number!), how far would you have to go to find someone with that condition? The end of your street, perhaps?
Selection/Sampling Bias
Diabetes disproportionately affects black people, but diabetes research disproportionately focuses on white people with diabetes. There are many possible reasons for this, the most obvious being systemic/institutional racism. For example, advertisements for clinical trial volunteer opportunities might appear more frequently amongst a convenient, nearby, mostly-white student body. The selection bias, therefore, made the study much less reliable.
Alternatively: a researcher is conducting a study on depression, and advertises for research subjects. He struggles to get a large enough sample size, because depressed people are less likely to respond, but eventually gets enough. Little does he know, even the most depressed of his subjects are relatively happy and healthy compared with the silent majority of depressed people who didn’t respond.
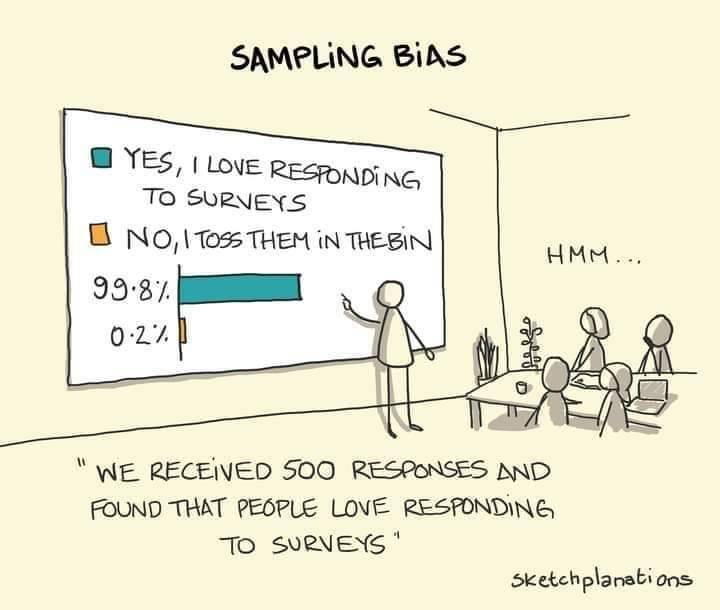
See This And Many More Educational Cartoons At Sketchplanations.com!
How to check for this: Does the “method” section of the scientific article describe how they took pains to make sure their sample was representative of the relevant population, and how did they decide what the relevant population was?
Publication Bias
Scientific publications will tend to prioritise statistical significance. Which seems great, right? We want statistically significant studies… don’t we?
We do, but: usually, in science, we consider something “statistically significant” when it hits the magical marker of p=0.05 (in other words, the probability of getting that result is 1/20, and the results are reliably coming back on the right side of that marker).
However, this can result in the clinic stopping testing once p=0.05 is reached, because they want to have their paper published. (“Yay, we’ve reached out magical marker and now our paper will be published”)
So, you can think of publication bias as the tendency for researchers to publish ‘positive’ results.
If it weren’t for publication bias, we would have a lot more studies that say “we tested this, and here are our results, which didn’t help answer our question at all”—which would be bad for the publication, but good for science, because data is data.
To put it in non-numerical terms: this is the same misrepresentation as the technically true phrase “when I misplace something, it’s always in the last place I look for it”—obviously it is, because that’s when you stop looking.
There’s not a good way to check for this, but be sure to check out sample sizes and see that they’re reassuringly large.
Reporting/Detection/Survivorship Bias
There’s a famous example of the rise in “popularity” of left-handedness. Whilst Americans born in ~1910 had a bit under a 3.5% chance of being left handed, those born in ~1950 had a bit under a 12% change.
Why did left-handedness become so much more prevalent all of a sudden, and then plateau at 12%?
Simple, that’s when schools stopped forcing left-handed children to use their right hands instead.
In a similar fashion, countries have generally found that homosexuality became a lot more common once decriminalized. Of course the real incidence almost certainly did not change—it just became more visible to research.
So, these biases are caused when the method of data collection and/or measurement leads to a systematic error in results.
How to check for this: you’ll need to think this through logically, on a case by case basis. Is there a reason that we might not be seeing or hearing from a certain demographic?
And perhaps most common of all…
Confounding Bias
This is the bias that relates to the well-known idea “correlation ≠ causation”.
Everyone has heard the funny examples, such as “ice cream sales cause shark attacks” (in reality, both are more likely to happen in similar places and times; when many people are at the beach, for instance).
How can any research paper possibly screw this one up?
Often they don’t and it’s a case of Spin Bias (see above), but examples that are not so obviously wrong “by common sense” often fly under the radar:
“Horse-riding found to be the sport that most extends longevity”
Should we all take up horse-riding to increase our lifespans? Probably not; the reality is that people who can afford horses can probably afford better than average healthcare, and lead easier, less stressful lives overall. The fact that people with horses typically have wealthier lifestyles than those without, is the confounding variable here.
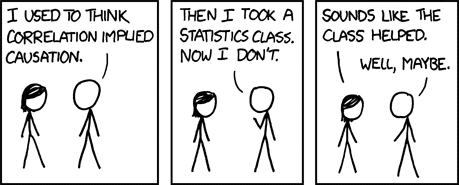
See This And Many More Educational Cartoons on XKCD.com!
In short, when you look at the scientific research papers cited in the articles you read (you do look at the studies, yes?), watch out for these biases that found their way into the research, and you’ll be able to draw your own conclusions, with well-informed confidence, about what the study actually tells us.
Science shouldn’t be gatekept, and definitely shouldn’t be abused, so the more people who know about these things, the better!
So…would one of your friends benefit from this knowledge? Forward it to them!
Share This Post

Learn To Grow
Sign up for weekly gardening tips, product reviews and discounts.
-
Stop Cancer 20 Years Ago
Dr. Jenn Simmons shares vital tips on preventing cancer and inflammation, advocating for lifestyle changes and proactive health management at any age.
Get Abreast And Keep Abreast
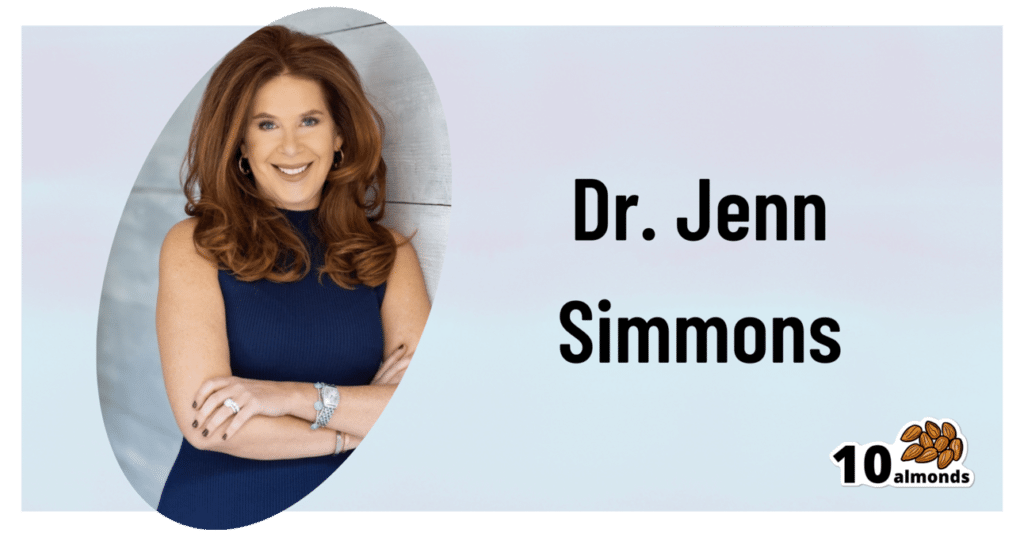
This is Dr. Jenn Simmons. Her specialization is integrative oncology, as she—then a breast cancer surgeon—got breast cancer, decided the system wasn’t nearly as good from the patients’ side of things as from the doctors’ side, and took to educate herself, and now others, on how things can be better.
What does she want us to know?
Start now
If you have breast cancer, the best time to start adjusting your lifestyle might be 20 years ago, but the second-best time is now. We realize our readers with breast cancer (or a history thereof) probably have indeed started already—all strength to you.
What this means for those of us without breast cancer (or a history therof) is: start now
Even if you don’t have a genetic risk factor, even if there’s no history of it in your family, there’s just no reason not to start now.
Start what, you ask? Taking away its roots. And how?
Inflammation as the root of cancer
To oversimplify: cancer occurs because an accidentally immortal cell replicates and replicates and replicates and takes any nearby resources to keep on going. While science doesn’t know all the details of how this happens, it is a factor of genetic mutation (itself a normal process, without which evolution would be impossible), something which in turn is accelerated by damage to the DNA. The damage to the DNA? That occurs (often as not) as a result of cellular oxidation. Cellular oxidation is far from the only genotoxic thing out there, and a lot of non-food “this thing causes cancer” warnings are usually about other kinds of genotoxicity. But cellular oxidation is a big one, and it’s one that we can fight vigorously with our lifestyle.
Because cellular oxidation and inflammation go hand-in-hand, reducing one tends to reduce the other. That’s why so often you’ll see in our Research Review Monday features, a line that goes something like:
“and now for those things that usually come together: antioxidant, anti-inflammatory, anticancer, and anti-aging”
So, fight inflammation now, and have a reduced risk of a lot of other woes later.
See: How to Prevent (or Reduce) Inflammation
Don’t settle for “normal”
People are told, correctly but not always helpfully, such things as:
- It’s normal to have less energy at your age
- It’s normal to have a weaker immune system at your age
- It’s normal to be at a higher risk of diabetes, heart disease, etc
…and many more. And these things are true! But that doesn’t mean we have to settle for them.
We can be all the way over on the healthy end of the distribution curve. We can do that!
(so can everyone else, given sufficient opportunity and resources, because health is not a zero-sum game)
If we’re going to get a cancer diagnosis, then our 60s are the decade where we’re most likely to get it. Earlier than that and the risk is extant but lower; later than that and technically the risk increases, but we probably got it already in our 60s.
So, if we be younger than 60, then now’s a good time to prepare to hit the ground running when we get there. And if we missed that chance, then again, the second-best time is now:
See: Focusing On Health In Our Sixties
Fast to live
Of course, anything can happen to anyone at any age (alas), but this is about the benefits of living a fasting lifestyle—that is to say, not just fasting for a 4-week health kick or something, but making it one’s “new normal” and just continuing it for life.
This doesn’t mean “never eat”, of course, but it does mean “practice intermittent fasting, if you can”—something that Dr. Simmons strongly advocates.
See: Intermittent Fasting: We Sort The Science From The Hype
While this calls back to the previous “fight inflammation”, it deserves its own mention here as a very specific way of fighting it.
It’s never too late
All of the advices that go before a cancer diagnosis, continue to stand afterwards too. There is no point of “well, I already have cancer, so what’s the harm in…?”
The harm in it after a diagnosis will be the same as the harm before. When it comes to lifestyle, preventing a cancer and preventing it from spreading are very much the same thing, which is also the same as shrinking it. Basically, if it’s anticancer, it’s anticancer, no matter whether it’s before, during, or after.
Dr. Simmons has seen too many patients get a diagnosis, and place their lives squarely in the hands of doctors, when doctors can only do so much.
Instead, Dr. Simmons recommends taking charge of your health as best you are able, today and onwards, no matter what. And that means two things:
- Knowing stuff
- Doing stuff
So it becomes our responsibility (and our lifeline) to educate ourselves, and take action accordingly.
Want to know more?
We recently reviewed her book, and heartily recommend it:
The Smart Woman’s Guide to Breast Cancer – by Dr. Jenn Simmons
Enjoy!